In my last post I told you that your next project will take longer than you think. Now I’ve destroyed hope I’m going to show you how you can use this knowledge to be better at software estimation. We’re going to use a simple but very effective technique first developed by the Navy back in the ’50s when they were building the Polaris nuclear submarine. Faced with tremendous risk and uncertainty, they had to work out how to build a missile that had never been built before, to be carried on a submarine more complex than contemporary technology would allow. And by the way, they had to work out how get a missile to launch underwater and hit a target thousands of miles away when no one had built a decent guidance system before. Oh, and the Russians were breathing down their neck with the Sputnik project. The Navy managed to develop a system of estimation and risk management that was so effective, they delivered three years early. Think your project is harder to estimate than that? Think again. Get on board and read on to find out how you can use this technique for your own means…
The real reason why your project will take longer than you think
What the Navy realized is that when you give a baseline estimate, the number you tend to give is how long you think it will take in ordinary circumstances; the outcome that will happen most of the time. This isn’t however the average amount of time the task will take. How so? Consider this extract from Bob Martin’s excellent book The Clean Coder where he describes a typical software estimation conversation:
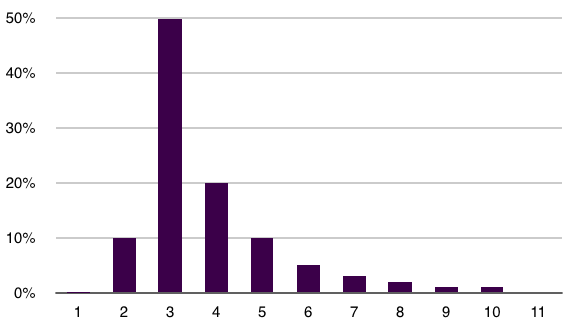
Mike: “How likely is it that you’ll be done in three days?
Peter: “Pretty likely.”
Mike: “Can you put a number on it?”
Peter: “Fifty or sixty percent.”
Mike: “So there’s a good chance that it’ll take you four days.”
Peter: “Yes, in fact it might even take me five or six, though I doubt it.”
Mike: “How much do you doubt it?”
Peter: “Oh, I don’t know … I’m ninety-five percent certain I’ll be done before six days have passed.”
Mike: “You mean it might be seven days?”
Peter: “Well, only if everything goes wrong. Heck, if everything goes wrong, it could take me ten or even eleven days. But it’s not very likely that so much will go wrong.”
As Uncle Bob goes on to explain, what’s going on here is that Mike is describing a probability distribution, something like this:

What is happening is that when you describe how long you think it will take, you are describing the mode – what will happen most often. However because there is more chance of running over than under, you need to take that into account. What the Navy did was find a really quick simple way of finding the mean by looking at three simple estimates for the duration of a task…
Three little estimates
They figured out that if you can get people to estimate these three possible outcomes, you can calculate the expected duration for a task:
Nominal (ψ)
This is the standard issue estimate, what people are used to giving—the amount of time you would expect a task to take under normal circumstances. In the example above it would probably be 3.
Nukem (ω)
This is the longest it could take if pretty much everything went wrong. This is the one in a thousand worst case scenario, the Nukem (for more on this read my last post). Mike’s Nukem is 11.
Mu-nicorn (μ)
I took extreme license with naming this one, but bear with me. This is the your estimate of how long this would take if the stars aligned, unicorns pair programmed with you and generally everything went so well you have to check yourself.
Super Simple Math
Now you have these estimates, you can calculate the expected duration of the task using this formula:
Te = (μ + 4ψ + ω)/6
You can also get the standard deviation of the estimate, which gives a measure of how uncertain the task is:
σ = (ω – μ )/6
Now, you can tell people that you are pretty confident that your task will take between Te-2σ and Te+2σ. This statement is not strictly correct, and I will explain at the end why this is so, but to keep it simple, I would use this.
Putting it to practice
In order to put this into on your project I would recommend breaking your app up into somewhat smaller, more manageable pieces for estimating. In theory, this helps because the law of large numbers implies that your errors cancel out. In practice, it’s also just plain easier to understand your app in small pieces. When you have your estimates for a number of tasks, you can simply add the expected times together to get the expected duration for the project. To get the standard deviation, you have to calculate the square root of the sum of the squares:
σ project = √ ∑ σ 2
Conclusion
There is nothing like real development data and experience to understand how long things are going to take. Unfortunately you will often have a situation when you don’t have that information available and you are still called upon to give a estimate. This technique can help you do that and have solid reasoning to back you up. I hope you find this useful, and if you want to look into estimation more, I highly recommend both Bob Martins book The Clean Coder mentioned above and Mike Cohn’s book on Agile Estimating and Planning
Post-script – there (probably) be dragons down here
This gets a little involved down here, so if you want to keep it simple, don’t worry about this stuff. As you are usually at the beginning of a project when you do this and are wildly imprecise anyway it shouldn’t make much difference.
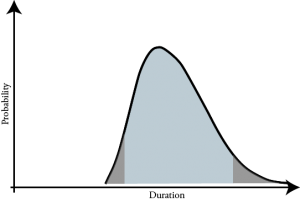
The more astute amongst you will have seen an issue with how we worked out our range by simply adding / subtracting two standard deviations from the estimated duration of the project. That assumes that its equally likely we run over as it is that we run under—that is, it’s a normal distribution like this:

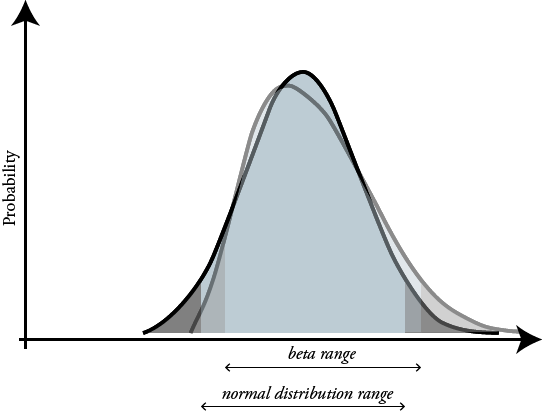
Trouble is, as we saw in the example, there is a tail off to the right. This is what’s known as a beta distribution (or at least an example of one), something more like this:

If you look at these overlaid onto one another, you see that the range estimate when using normal distribution actually underestimates the duration a bit. If you want to keep things simple you are probably ok, but it’s worth knowing:

The shape of the distribution is called a beta distribution, and it makes the math for working out the range quite a bit more complicated. You need to calculate a couple of variables that describe the shape of the curve: α and β. These are a bit complicated to work out, but for the sake of completeness, I hunted them down for you here. They are:
α = ((mean-min)/(max-min)) * ((((mean-min)*(max-mean))/σ2)-1)
β = (max-mean)/(mean-min)*α
Once you have these, you can use the Excel BETAINV function to get your minimum and maximum ranges. For example, if you want to calculate an duration as a range you can have 95% confidence in:
low end of range = BETAINV(0.025,α,β,min,max)
high end of range = BETAINV(0.975,α,β,min,max)
[…] Skip to content How long will your project take? « Software Estimation — A good simple way courtesy of the Navy and the cold war Try this, my mini-application for software estimation By Paul Barnes-Hoggett | Published: July 5, […]
[…] Software Estimation — A simple method brought to you by the cold war […]
Thanks for the article… very helpful! I noticed that your code for determining curve shape “A” does not match the article you link to. It should be:
α = ((mean-min)/(max-min)) * ((((mean-min)*(max-mean))/σ2)-1)
Thanks Noah! Updated it now…